I have always been curious about network analysis and its possibilities in visualizing connections between data. As you must have already read in my previous posts Getting to Know Distant Reading Techniques and Topic Modeling Twentieth Century Cartoons , since last summer I have been working in a project about a very popular Afro Argentinian man in the first decades of twentieth century Argentina, known as El Negro Raul. The work I did during last summer was mostly text mining analysis and I looked forward to experimenting with other techniques, such as network analysis. Specifically, I am curious about the connections that may appear between the people who wrote about Raul and their publishers. Part of Raul’s corpus up to now includes a collection of magazine,newspaper and journal articles between 1910 and the present times in which El Negro Raul is mentioned. I am interested in seeing which journals, newspapers and magazines gave more attention to this popular character and to see if the same authors were publishing in different places at the same time. I believe that being able to visualize this connections in a graph will give me some answer to my questions and, at the same time, generate some other questions. Since this is my first time exploring this technique, I have decided to:
- Use a sample data of my corpus for my initial experiment. That is, to select just a piece of the sources and to see what I get, and then move forward in adding more data.
- Get started with Palladio for my initial experiments. Palladio is a tool that allows you to visualize historical data, in a very easy way. Having an initial view of this data in Palladio, will help me to better prepare my data (and the connections I want to establish between it) for running future visualizations in Gephi
Preparing the Data
Now that I have already established my initial goals, I have to create a table that will allow me to create a network graph with Palladio. I have the corpus in Zotero, so I will export the library and randomly select 55 files from the Press and Popular Press category. I will also limit the information from these files to: . Item Type . Publication Year . Author . Title . Publisher First problem: I do not have complete information for all of these files. I have some without Publication Year and others without Author Name. To avoid leaving blank cells, I am writing 99 for all the unknown information. After the cleaning, I now have a table with data to get started with.
Putting the Data in Palladio
Adding the data in Palladio is really easy, you just have to paste your table and click the Load button. You are creating a project in Palladio by doing this. I name my project as Press and Popular Press_El Negro Raul and I can now move through the different sections to experiment with my data. For the purposes of this post, I will only be commenting about the Graph feature, since I am interesting in what a network graph can show me about my data.
Visualizing Connections
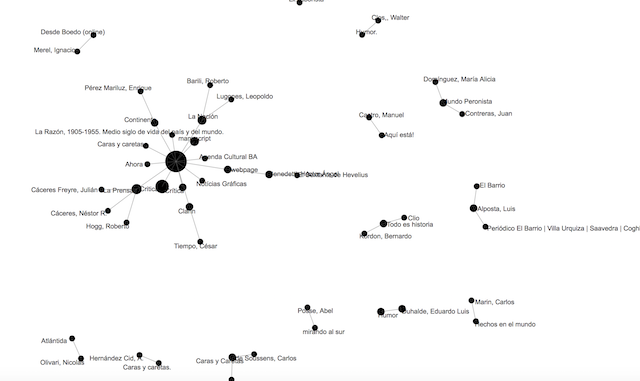
In the Graph section, I need to select the Source and Target so as to see my graph. I am choosing Author and Publisher to get started. This is what I get:
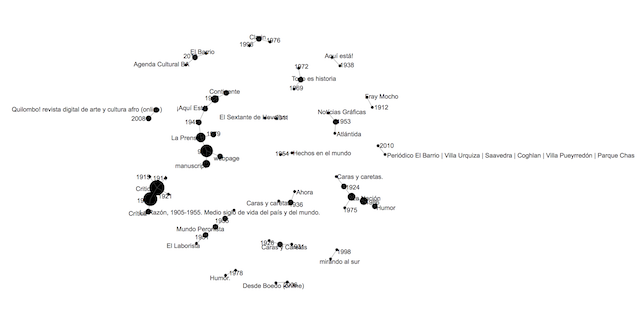
I am now choosing Publisher and Year:
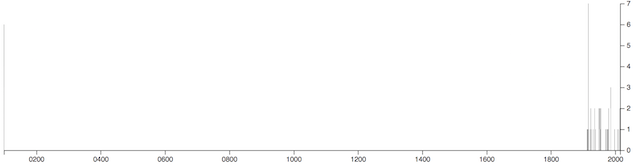
For a better understanding, I think that using the Timeline feature could also help me, so I try it as well:
Questions answered?
I have to say that since I worked with a really small data, most of the connections that appeared in the graph were already noticed, just by cleaning the table. Newspapers Critica, La Prensa and La Nacion were the ones that published most about El Negro Raul. Moreover, the timeline showed that the highest amount of publications was in 1916, and this makes lot of sense if we think in the historical context of Argentina within that year. In 1916 a new party came to power and its leader, Hypolito Yrigoyen was intending to break with the conservadurism of the previous decades. Anxieties among the traditional ruling classes grew up by that year and discussions about the bases of their power were present in newspapers and magazines. Raul was known as being the “clown” of the sons of the traditional elite, so it makes sense to have lot of publications that talked about the life of these rich kids and their “nocturnal adventures”. In sum, having done this initial experiments with a small amount of data didn’t bring new insights to my current analog findings and speculations, but it made me think on the possibility of having original insights by using a larger set of sources, which will be impossible to analogically analyze. Moreover, the network graphs serve as useful visualizations of the connections between the data and could help to present your analysis in different ways.
What next?
After this initial approach to network analysis by using Palladio and a sample of my corpus to get started with, I will now move forward in adding more data to my analysis, the same as to try them in Gephi. Moreover, I have some parallel questions that I would like to tackle, now in terms of the connections between the authors and the people besides El Negro Raul that they were writing about. I’m specifically thinking in the sons of the Argentinian elite by the beginning of the twentieth century. I am interested who and where is mentioned by these authors, as it will give me a better understanding of the social and political context of these years. This will be a second phase in the network analysis as I will need first to extract these names from the texts and then to prepare the data to run the visualizations. I’m confident that using larger sets of data will bring new ideas to my current speculations and hypothesis.
... Back to top ...